
App Logo

Download Our App

Shop your way

logologo
Image

World Day to Combat Desertification

06/18/2026By: ICN Writer
World Day to Combat Desertification

Why this day matters

The World Day to Combat Desertification and Drought, observed each year on 17 June, focuses attention on land as a practical foundation for food, water security, and stable local economies. It is linked to the UN Convention to Combat Desertification and highlights a simple message: land degradation is not only an environmental issue, it is also a productivity issue that affects farms, rangelands, cities, and supply chains. The day is used by governments, research institutions, and civil society to share data, announce restoration programs, and promote land management practices that keep soils fertile and water available. Desertification is often misunderstood as “deserts expanding.” In policy and science, it refers to land degradation in drylands caused by climate variability and human activities. Drought is a temporary shortage of water, but repeated droughts can accelerate degradation when soils are bare, overgrazed, or poorly managed. The day matters because it connects these concepts to decisions people make every season: how fields are irrigated, how grazing is rotated, how vegetation is protected, and how cities plan water demand. It also encourages measurable commitments, such as restoring degraded hectares, improving soil organic matter, and reducing water losses in agriculture.

What drives desertification and drought impacts

Land degradation in drylands is rarely caused by a single factor. Climate trends such as rising temperatures increase evaporation and plant water stress, while rainfall becomes more variable, arriving in shorter and more intense events that can trigger runoff and erosion. When soils lose structure and organic matter, they absorb less water, so the same rain produces less useful moisture for crops and more sediment in waterways. Human pressures often determine whether a dry year becomes a crisis. Over-extraction of groundwater can lower water tables and increase pumping costs, pushing farmers to abandon fields or switch to lower-value crops. Inefficient irrigation, especially where canals leak or fields are over-watered, wastes scarce resources and can lead to salinity, which reduces yields and can render land unproductive. Overgrazing reduces plant cover and root systems that stabilize soil, and it can also reduce the seed bank needed for recovery after drought. Poorly planned land conversion, such as clearing shrubs without erosion control, increases wind erosion and dust. These drivers interact: degraded land amplifies drought impacts, and drought accelerates degradation, creating a feedback loop that is difficult and expensive to reverse.

How land degradation affects economies and health

The most immediate impact is reduced agricultural productivity. Lower yields affect farm income, local food availability, and prices, especially in regions where rainfed farming and pastoralism are major livelihoods. Degraded rangelands can support fewer animals, and herders may face higher feed costs or longer travel to find grazing and water. In irrigated areas, salinity and waterlogging can force costly rehabilitation or lead to land abandonment. Beyond farms, land degradation affects infrastructure and public services. Increased sedimentation can reduce reservoir capacity, raising water treatment costs and lowering hydropower efficiency where it exists. Dust and sand movement can damage roads, clog irrigation equipment, and increase maintenance costs for municipalities. Health impacts are also documented: higher dust levels can worsen respiratory conditions, and drought can strain water supply systems, increasing the risk of unsafe water storage practices. Economically, these pressures can reduce employment in agriculture-related sectors, weaken rural markets, and increase fiscal burdens on governments that must respond with emergency water deliveries or subsidies. The World Day emphasizes that prevention and early action are typically cheaper than late-stage recovery.

Solutions that work on the ground

Effective responses combine soil, water, and vegetation management. In croplands, conservation agriculture practices—such as reduced tillage, keeping soil covered with residues or cover crops, and diversified rotations—can improve soil structure and water infiltration. Adding organic amendments where feasible supports soil organic matter, which helps retain moisture. In dry regions, selecting drought-tolerant varieties and adjusting planting dates based on seasonal forecasts can reduce risk. Water management is central. Modernizing irrigation with drip or sprinkler systems can reduce losses, but benefits depend on good scheduling, maintenance, and governance that prevents “saved water” from simply expanding consumption. Lining canals, fixing leaks, and using soil moisture monitoring can deliver quick gains. In rangelands, rotational grazing, resting degraded areas, and reseeding native species can rebuild plant cover. Windbreaks, shelterbelts, and dune stabilization using local vegetation reduce erosion and protect farms and roads. Restoration at landscape scale often requires coordinated planning: protecting upstream catchments to reduce erosion, restoring wetlands where appropriate, and integrating agroforestry in suitable zones. The most successful programs include clear land tenure arrangements, incentives for farmers and herders, and extension services that translate research into practical steps. Monitoring is also essential, using indicators such as vegetation cover, soil organic carbon, groundwater levels, and yield stability over time.

What institutions and cities can do

Public policy can reduce land degradation by aligning incentives with sustainable practices. This includes supporting drought risk management plans, improving meteorological and hydrological monitoring, and making early warning information accessible to farmers and water utilities. Land-use planning can protect vulnerable soils from inappropriate development and can designate grazing corridors and restoration zones. Financing tools—such as results-based payments for restoration, insurance products tied to rainfall indices, and credit for efficient irrigation—can help households invest in resilience. Cities also have a direct role because urban water demand competes with agriculture and ecosystems. Reducing non-revenue water through leak detection, pressure management, and pipe rehabilitation can free significant volumes. Expanding wastewater treatment and safe reuse for landscaping or certain crops can reduce pressure on freshwater sources when managed under clear standards. Urban procurement policies can encourage suppliers to adopt soil and water stewardship, especially for commodities sourced from dry regions. Research institutions contribute by improving drought forecasting, developing locally adapted crop varieties, and evaluating restoration outcomes. Importantly, data should be translated into practical guidance: how to schedule irrigation, how to manage salinity, and how to select species for revegetation. Partnerships between ministries, municipalities, universities, and producer organizations are often the difference between pilot projects and durable, scaled programs.

Practical actions for individuals and communities

Individuals cannot solve desertification alone, but local choices add up. Water-saving habits at home—fixing leaks, using efficient fixtures, and watering gardens at appropriate times—reduce pressure on shared supplies. In dry regions, choosing native or drought-tolerant plants for landscaping lowers irrigation demand and improves survival rates. Supporting food products sourced from farms that use efficient irrigation or soil conservation practices can shift market incentives. Community groups can contribute through tree and shrub planting programs that prioritize suitable species and long-term maintenance, not just planting numbers. Schools can use the World Day as a moment to teach soil basics, erosion prevention, and the value of ground cover, linking lessons to local field visits. Farmer and herder associations can organize training on grazing rotation, water harvesting structures, and salinity management, and they can negotiate collectively for services such as soil testing or equipment maintenance. A useful way to engage with the day is to focus on measurable local goals for the next 12 months: a target to reduce household water use, a plan to rehabilitate a specific degraded plot, or a community agreement on grazing schedules. These actions are small compared with national programs, but they build the habits and cooperation that make larger restoration efforts possible.

* All articles published on this blog are sourced from various websites and are provided for informational purposes only. They should not be considered as confirmed studies or accurate information. Please verify the information independently before relying on it.

Similar ARTICLES

How Cities Measure Heat With Satellites
Urban heat is often discussed as a general problem, but city planners need block-by-block evidence to decide where to plant trees, change paving, or adjust building codes. Traditional weather stations are accurate at a point, yet they are sparse and can miss sharp temperature differences between a shaded park, a wide asphalt road, and a dense commercial district. That gap matters because heat exposure is shaped by local surfaces, building height, wind corridors, and the timing of shade. Satellite remote sensing offers a way to map temperature patterns across an entire city on the same day, using consistent methods. The key product is land surface temperature, which describes how hot the ground and rooftops are, not the air temperature people see on a phone app. Understanding the difference is essential: surfaces can be far hotter than the air, and they influence the air through radiation and convection. A serious article can show how cities translate satellite maps into practical decisions, and what limitations must be respected to avoid misleading conclusions.
Microplastics in Drinking Water Explained
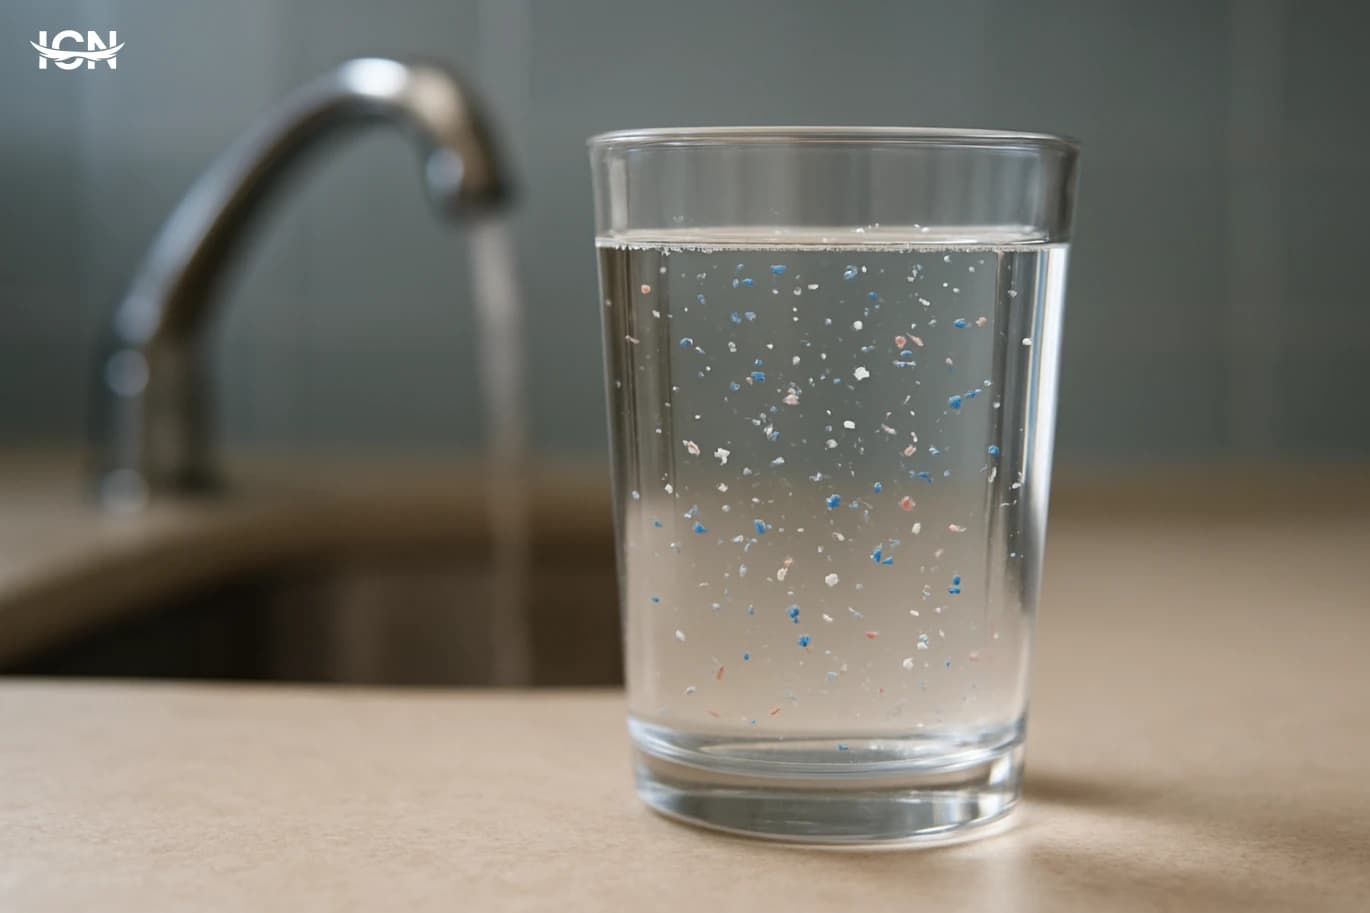
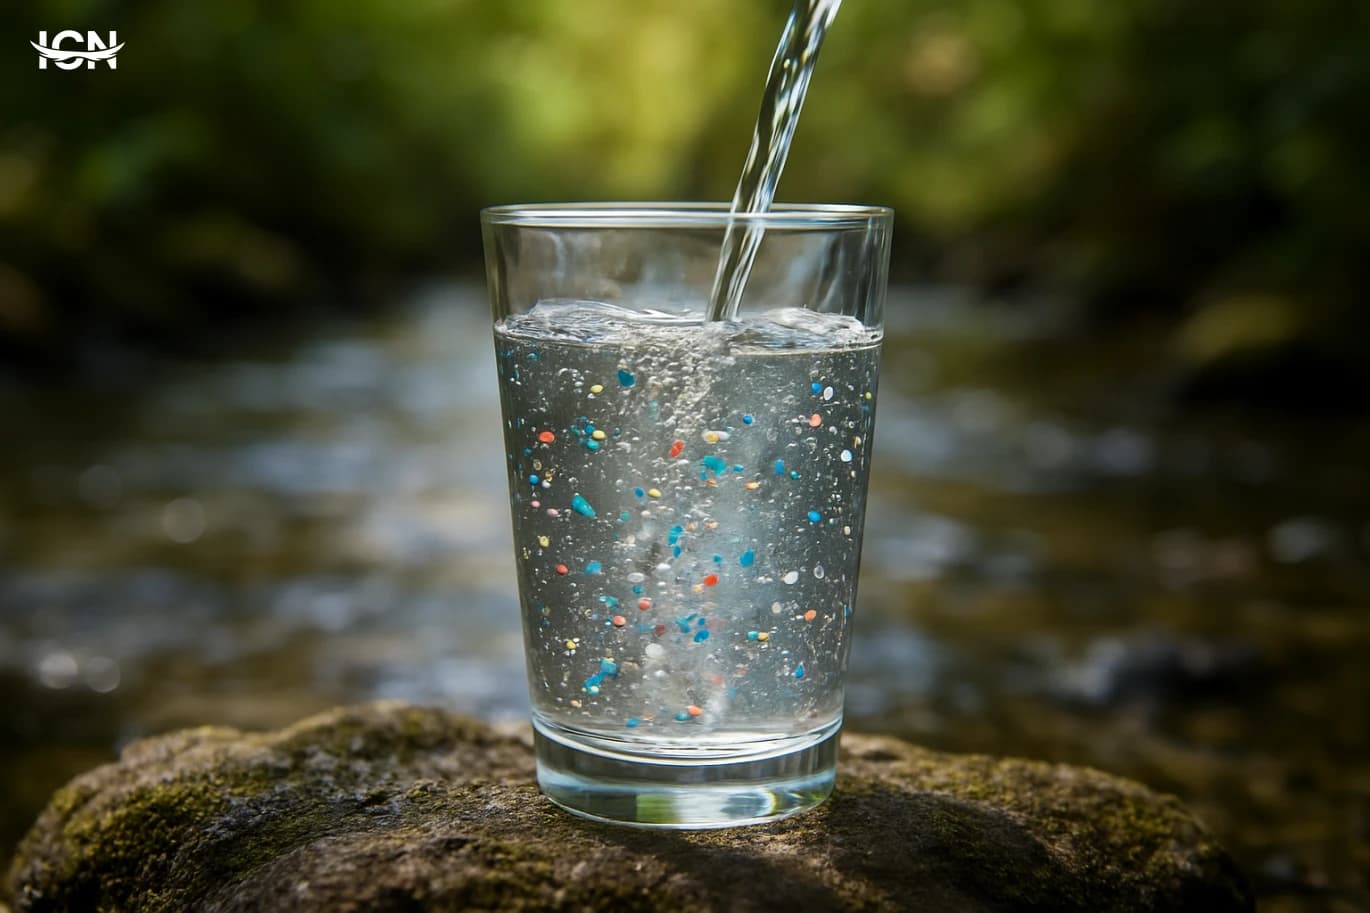
Microplastics are tiny plastic particles, generally smaller than 5 millimeters, that come from the breakdown of larger plastic items or from products that shed fragments during use. In water research, scientists often distinguish between microplastics and even smaller “nanoplastics,” which can be harder to detect with routine methods. The reason microplastics matter in drinking water is not only their presence, but their potential to carry additives, pick up pollutants from the environment, and interact with biological systems in ways that are still being mapped. In recent years, microplastics have been reported in rivers, lakes, groundwater, and treated tap water in multiple regions. That does not automatically mean every glass of water is unsafe, but it does mean the topic has moved from a niche environmental concern to a mainstream public health and infrastructure question. Researchers are now asking practical questions: where do these particles enter water supplies, how well do treatment plants remove them, and what exposure levels are realistic for different communities. A key point in scientific articles is uncertainty. Measuring microplastics is technically challenging because particles vary widely in size, shape, polymer type, and surface chemistry. Two studies can report different numbers simply because they used different sampling volumes, filters, or identification techniques. Understanding these limitations helps readers interpret headlines and focus on what the evidence can and cannot claim today.
How Microplastics Move Through the Human Body
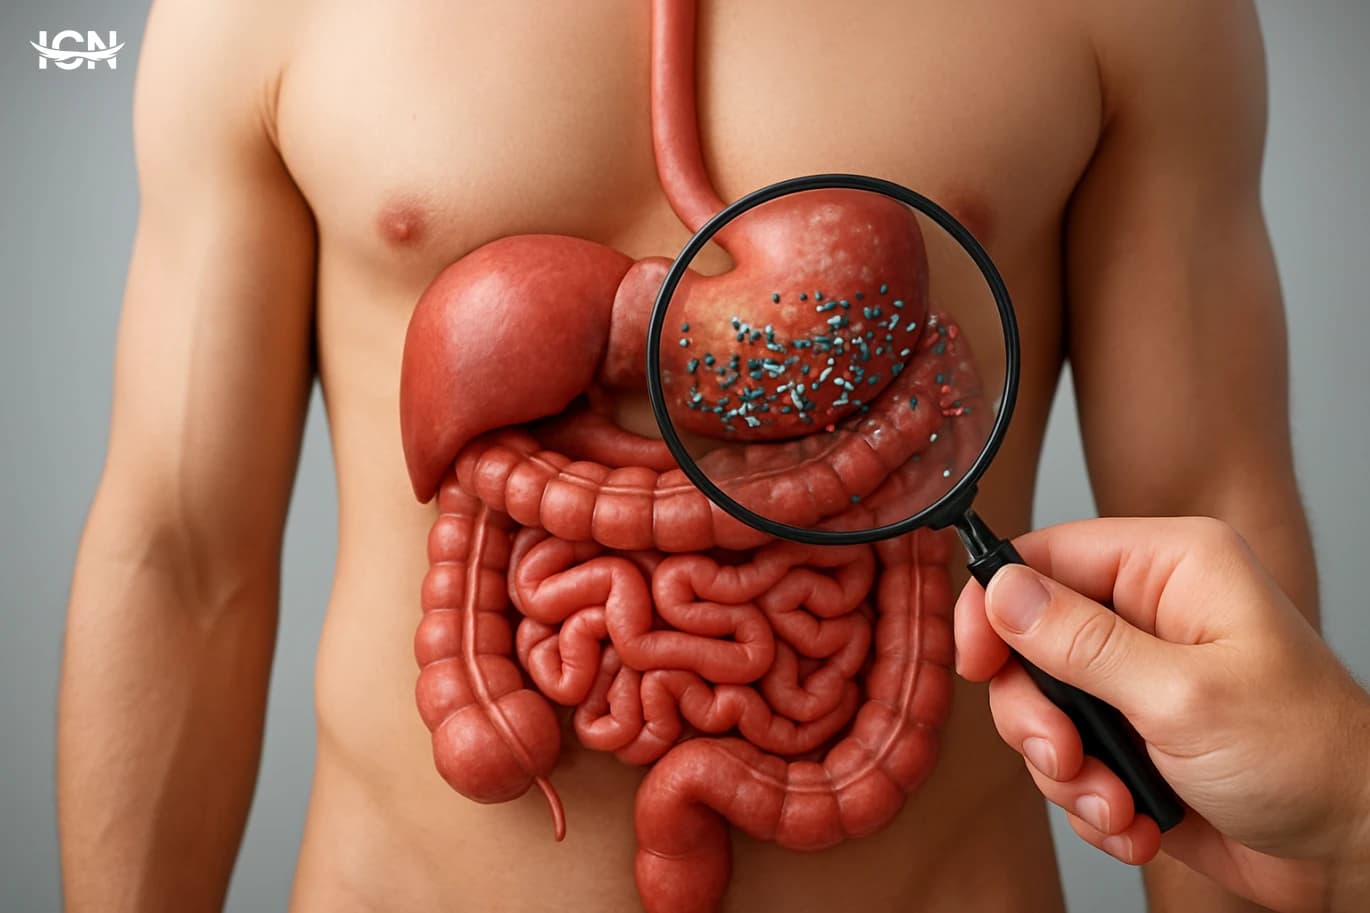
Microplastics are no longer only an ocean or wildlife issue; they are increasingly studied as a human exposure problem. Researchers have detected tiny plastic particles in drinking water, table salt, indoor dust, and a range of foods, which means everyday intake is plausible even without obvious pollution sources. The scientific focus has shifted from “are we exposed?” to “what happens after exposure?” because health risk depends on where particles travel, how long they persist, and whether they trigger biological responses. This article topic examines the current evidence on how microplastics can enter the body, move between organs, and leave the body, while clarifying what is known versus what remains uncertain. It also highlights why particle size, shape, and polymer type matter for transport, and why measurement methods can change the conclusions. The goal is to give readers a clear map of the research landscape without overstating the strength of the data.
How Microplastics Enter the Human Body
Microplastics are plastic fragments typically smaller than 5 millimeters, and they have moved from being an environmental concern to a public health research priority. Scientists track them because they are now detected in oceans, rivers, soils, household dust, and food packaging, creating multiple pathways for human exposure. The research focus is not only on how much plastic is present, but on particle size, shape, and polymer type, because these factors influence where particles travel and how they interact with tissues. Another reason for urgency is that microplastics can carry additives and can adsorb other chemicals from the environment, complicating exposure assessment. In recent years, laboratories have improved detection methods, allowing studies to report microplastics in samples that were previously difficult to analyze, such as air filters, drinking water, and biological fluids. This shift has pushed the topic into mainstream scientific articles, where the central question is increasingly practical: what are the most common routes into the body, and what can be measured reliably today?
How Wastewater Reveals Community Health Trends
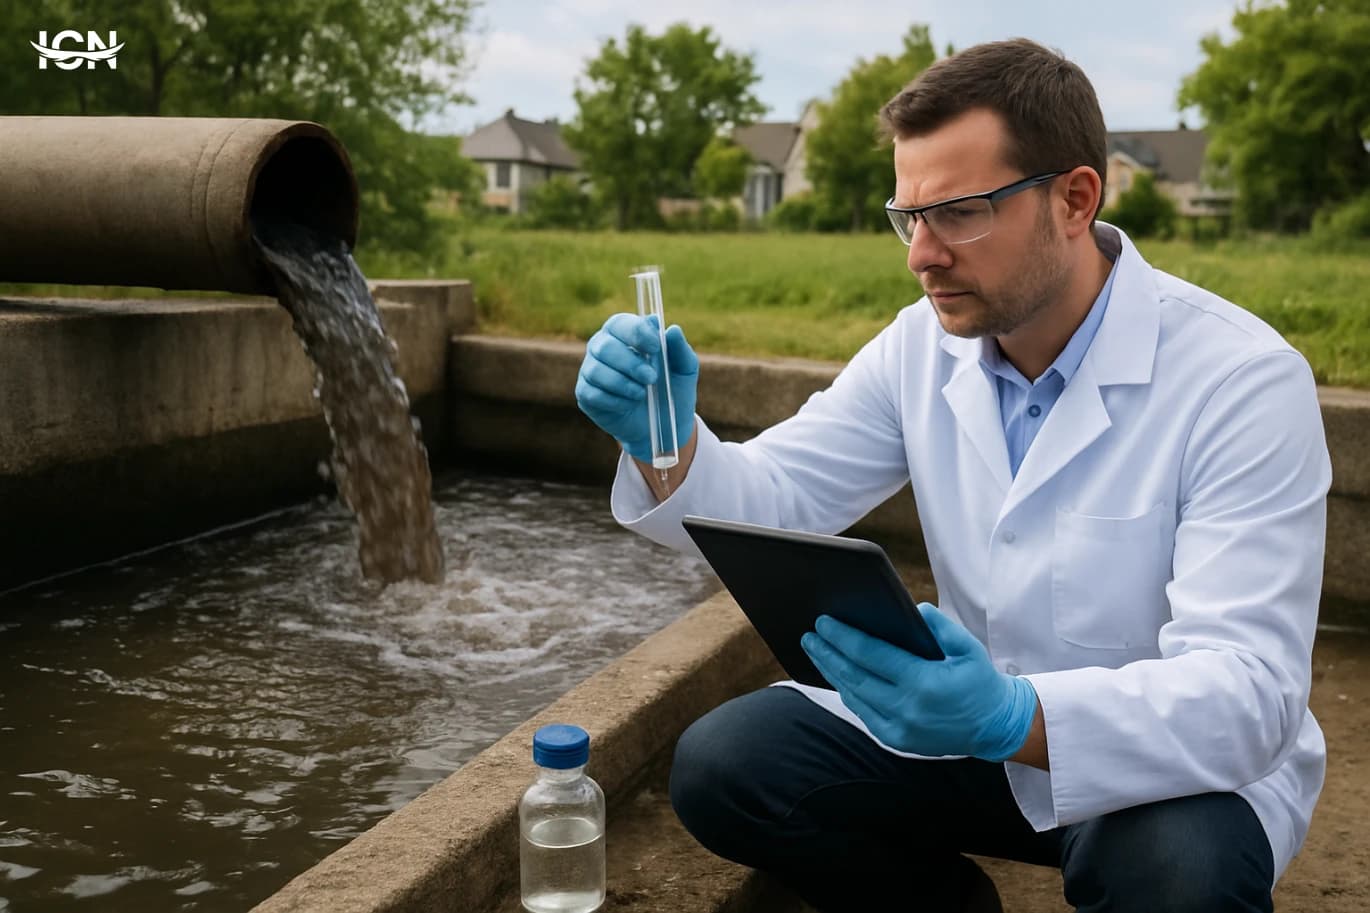
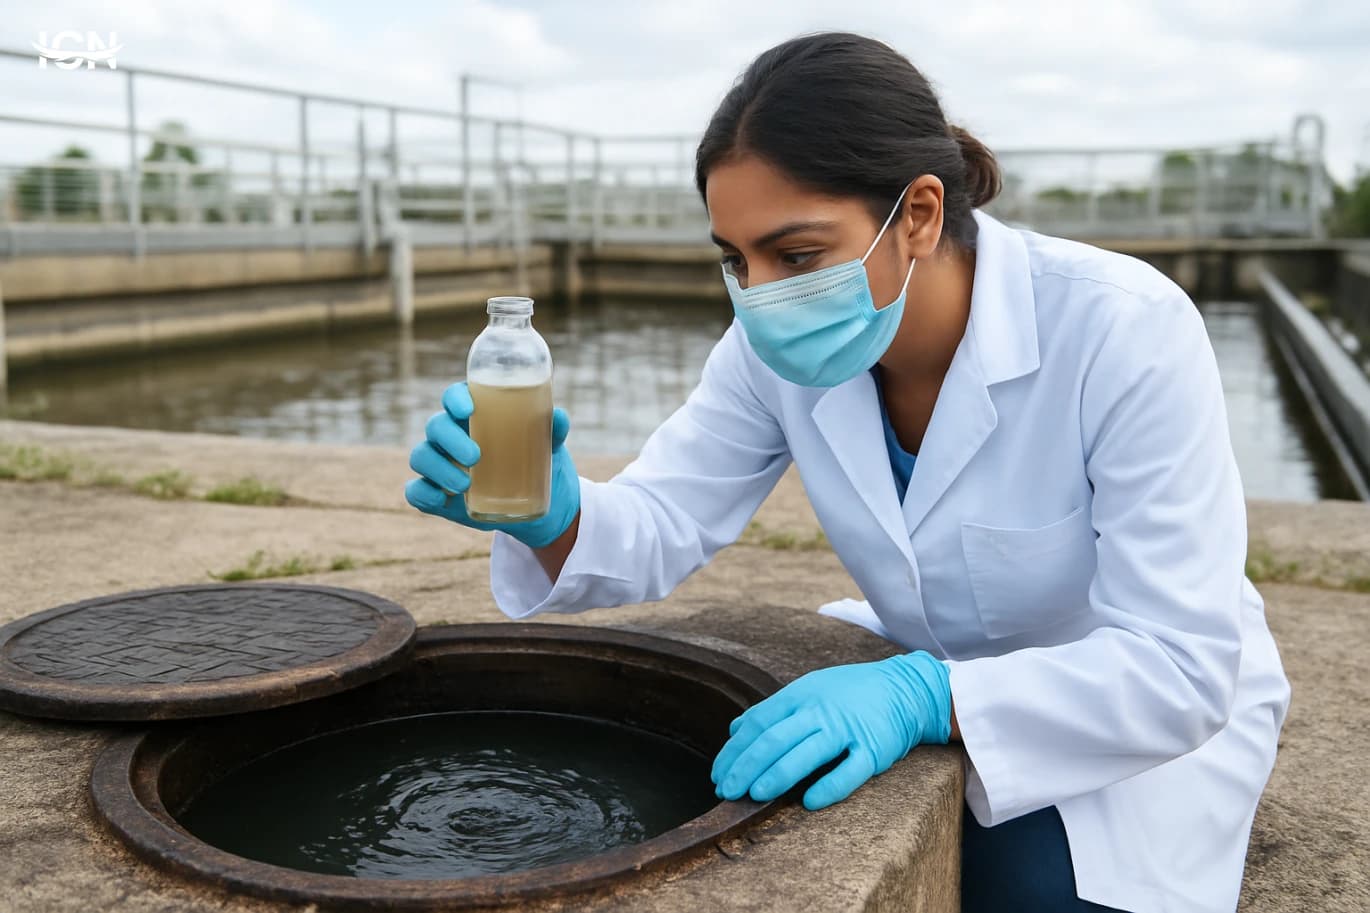
Wastewater-based epidemiology (WBE) turns what flows through sewers into measurable signals about a community’s health. When people take medications, get infected with viruses, or are exposed to certain chemicals, traces of those substances or their breakdown products can end up in urine and feces. Those traces mix in the sewer network, creating a pooled sample that represents thousands to millions of residents. Scientists can collect wastewater at treatment plants or key pumping stations and analyze it to estimate trends without testing individuals. This approach is not new, but it has matured quickly because modern molecular and chemical methods can detect very small amounts of genetic material and metabolites. WBE is especially useful when clinical testing is limited, delayed, or biased toward people who seek care. It can also provide early warning, because changes in wastewater can appear before hospitals see a surge. The result is a complementary dataset: not a replacement for clinical surveillance, but a broad, population-level lens that can help public health teams allocate resources, evaluate interventions, and communicate risk with more timely evidence.
Beating the Wolf Hour Wake-Up
Many people describe a frustrating pattern: they fall asleep normally, then wake up suddenly between roughly 2:00 and 4:00 a.m., alert enough to check the clock and unable to drift back. Popular culture calls it the “wolf hour,” but sleep science treats it as a common form of middle-of-the-night awakening. It is not a mystery event; it is usually the result of normal sleep architecture colliding with stress biology, light exposure, temperature shifts, and habits that push the brain toward wakefulness. Sleep is organized into cycles of about 90 minutes, moving through lighter and deeper stages and then REM sleep. In the second half of the night, REM periods become longer and sleep tends to be lighter. That makes awakenings more likely, and if the brain receives a strong “wake signal” at that moment—worry, a notification, a warm room, alcohol rebound, or a blood-sugar dip—the awakening can become prolonged. The key point is that the timing is predictable: the body’s circadian rhythm is preparing for morning, and the sleep system is more fragile. This pattern affects millions because it is easy to trigger and hard to ignore. People often respond by trying harder to sleep, checking the time repeatedly, or scrolling on a phone, which increases arousal and teaches the brain that 3 a.m. is a time for thinking. A scientific approach focuses on reducing arousal, strengthening circadian cues, and using behavioral tools that retrain the association between bed and sleep.
How Microplastics Move Through the Human Body
Microplastics are fragments and fibers typically smaller than 5 millimeters, produced when larger plastic items break down or when synthetic materials shed during use. For years they were treated mainly as an environmental pollutant, measured in oceans, rivers, and soils. The topic shifted toward medicine as detection methods improved and researchers began reporting particles in places that matter for human health, including drinking water, food, indoor air, and household dust. Exposure is not limited to coastal regions or specific occupations; it can occur in ordinary daily routines such as eating packaged foods, drinking from plastic containers, or inhaling airborne fibers released from textiles. The scientific question is no longer only whether microplastics exist around us, but how they enter the body, where they travel, and what biological processes they might disrupt. This requires combining analytical chemistry, toxicology, and clinical research. It also demands careful language: finding particles in a sample does not automatically prove disease causation. A serious discussion focuses on pathways, doses, particle types, and the quality of evidence, while acknowledging uncertainty and the need for standardized methods across laboratories.
How Microplastics Move Through Our Bodies
Microplastics are tiny plastic fragments and fibers that come from the breakdown of larger products, synthetic textiles, tire wear, and industrial pellets. For years they were discussed mainly as an ocean and wildlife problem, but research has expanded because these particles are now detected in everyday environments: indoor dust, drinking water, and a range of foods. The health question is not built on a single alarming finding; it is built on repeated measurements showing that exposure is routine, and on basic biology suggesting that very small particles can interact with tissues. Scientific articles increasingly focus on two practical issues: where exposure happens and what size and chemistry matter most. A key point is that “microplastics” is a broad label. Particles differ by polymer type, additives, surface coatings, and whether they carry other chemicals on their surface. They also differ by shape: fibers, fragments, films, and spheres. These differences can change how particles behave in air and water, how they are taken up by the body, and how researchers should measure them.
Microplastics in Drinking Water What Science Shows
Microplastics moved from an ocean-pollution headline to a household concern once researchers began detecting tiny plastic particles in tap water, bottled water, and even treated wastewater. The scientific question is not only whether particles are present, but how they get there and what their presence means for exposure. Sources include fragmentation of larger plastics, shedding from synthetic textiles during washing, wear from tires and road dust, and breakdown of coatings and packaging. These particles can enter rivers and reservoirs through stormwater runoff and wastewater effluent, then pass through drinking-water treatment at varying rates depending on particle size and treatment design. The topic matters because drinking water is a daily, repeated exposure route, and because public discussion often mixes confirmed findings with assumptions. A careful article can separate what is measured from what is inferred, and explain why different studies report different numbers. It can also clarify terminology: “microplastics” typically refers to particles smaller than 5 millimeters, while “nanoplastics” are far smaller and harder to measure with routine methods. Understanding that measurement limits shape the evidence is essential for interpreting headlines and for making practical decisions about monitoring and treatment.
Microplastics Inside the Human Body
Microplastics are tiny fragments shed from packaging, synthetic textiles, tires, and many everyday products. For years they were treated mainly as an environmental issue, measured in oceans and wildlife. That changed as researchers began detecting these particles in places directly connected to human exposure: drinking water, table salt, seafood, and indoor air. The scientific question is no longer whether people encounter microplastics, but how much enters the body and what happens after exposure. This topic sits at the intersection of analytical chemistry, toxicology, and public health. Scientists must first define what counts as “microplastic,” because size thresholds, polymer types, and shapes vary across studies. They also must separate plastic particles from other debris, avoid contamination from lab equipment, and report results in comparable units. Those practical details shape headlines and policy discussions, yet they are often missing from public summaries. A clear article can explain what the evidence actually shows, what remains uncertain, and why the next generation of studies is focusing on internal measurements rather than environmental sampling alone.
How Wastewater Reveals Community Health Trends
Wastewater-based epidemiology is the practice of analyzing sewage to estimate what is happening in a community’s health and environment. The idea is straightforward: what people excrete, wash off, or discard ends up in sewers, where it becomes a pooled sample representing thousands to millions of residents. Scientists can measure genetic fragments from viruses, chemical traces from medications, and markers of industrial or household chemicals. Because the sample is aggregated, it can reveal trends without requiring every individual to take a test or fill out a survey. Public health agencies became widely aware of this approach during the COVID-19 pandemic, when viral RNA in wastewater often rose before clinical case counts increased. That early signal mattered in places where testing access was limited or where people used at-home tests that were not reported. Beyond infectious diseases, wastewater monitoring is now used to track seasonal influenza, antimicrobial resistance genes, and population-level exposure to substances such as nicotine metabolites. The scientific value is not in identifying individuals, but in providing timely, population-scale indicators that can guide targeted outreach, resource planning, and follow-up studies.
How Wastewater Reveals Community Health Trends
Wastewater carries a combined chemical and biological “fingerprint” of a community. When people use medicines, eat certain foods, or get exposed to environmental chemicals, traces of those substances and their breakdown products can end up in sewage. Public health researchers analyze these traces to estimate what is happening across a city or neighborhood without needing to test individuals. This approach is often called wastewater-based epidemiology, and it has expanded from tracking illicit drugs to monitoring viruses, antibiotic resistance markers, and indicators of chronic disease risk. The appeal is practical. A single treatment plant can represent hundreds of thousands of residents, providing a broad snapshot at relatively low cost. Sampling can be repeated daily or weekly, allowing analysts to see changes over time and to detect sudden shifts that might signal an outbreak, a change in prescribing patterns, or a new exposure source. Because the data are aggregated, it can complement clinical reporting and surveys, especially when healthcare access is uneven or when people do not seek testing.
Why an Hour Has 60 Minutes
Most people learn early that an hour equals 60 minutes, then stop thinking about it. Yet “60” is not an obvious choice like 10 or 100, and it is not dictated by nature in the way a day is tied to Earth’s rotation. The 60-minute hour is a human convention that became global because it was practical, teachable, and compatible with earlier ways of counting and measuring. To understand why 60 survived, it helps to separate three layers: how ancient societies counted, how they divided the day, and how later science and technology locked those divisions into standards. The hour and minute are not random; they are the result of a long chain of decisions that favored easy division, reliable record-keeping, and shared reference points for trade, astronomy, and eventually transportation and telecommunications.
By clicking the SUBSCRIBE button, you are agreeing to our Privacy & Cookie Policy If you want to unsubsribe the marketing email, please proceed to our privacy center.
© 2005-2026 ICN. All Rights Reserved.