



Microplastics in Drinking Water What Science Shows
- Why microplastics became a drinking-water question
- How scientists detect particles in water samples
- What studies find in tap and bottled water
- Health evidence what is known and what is uncertain
- What treatment plants and home filters can do
- What to watch next standards monitoring and better data
Why microplastics became a drinking-water question
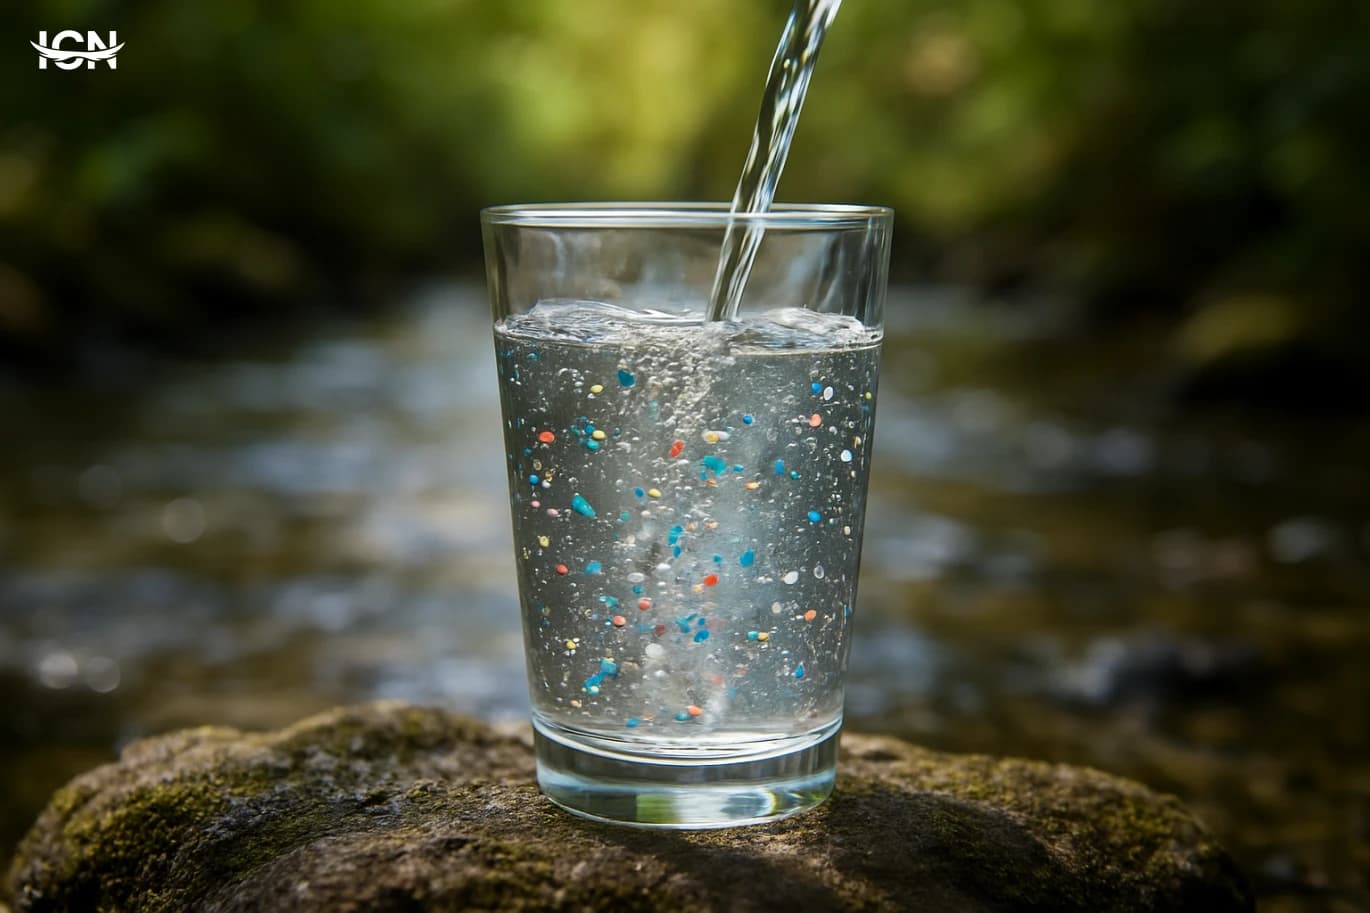
Microplastics moved from an ocean-pollution headline to a household concern once researchers began detecting tiny plastic particles in tap water, bottled water, and even treated wastewater. The scientific question is not only whether particles are present, but how they get there and what their presence means for exposure. Sources include fragmentation of larger plastics, shedding from synthetic textiles during washing, wear from tires and road dust, and breakdown of coatings and packaging. These particles can enter rivers and reservoirs through stormwater runoff and wastewater effluent, then pass through drinking-water treatment at varying rates depending on particle size and treatment design. The topic matters because drinking water is a daily, repeated exposure route, and because public discussion often mixes confirmed findings with assumptions. A careful article can separate what is measured from what is inferred, and explain why different studies report different numbers. It can also clarify terminology: “microplastics” typically refers to particles smaller than 5 millimeters, while “nanoplastics” are far smaller and harder to measure with routine methods. Understanding that measurement limits shape the evidence is essential for interpreting headlines and for making practical decisions about monitoring and treatment.
How scientists detect particles in water samples
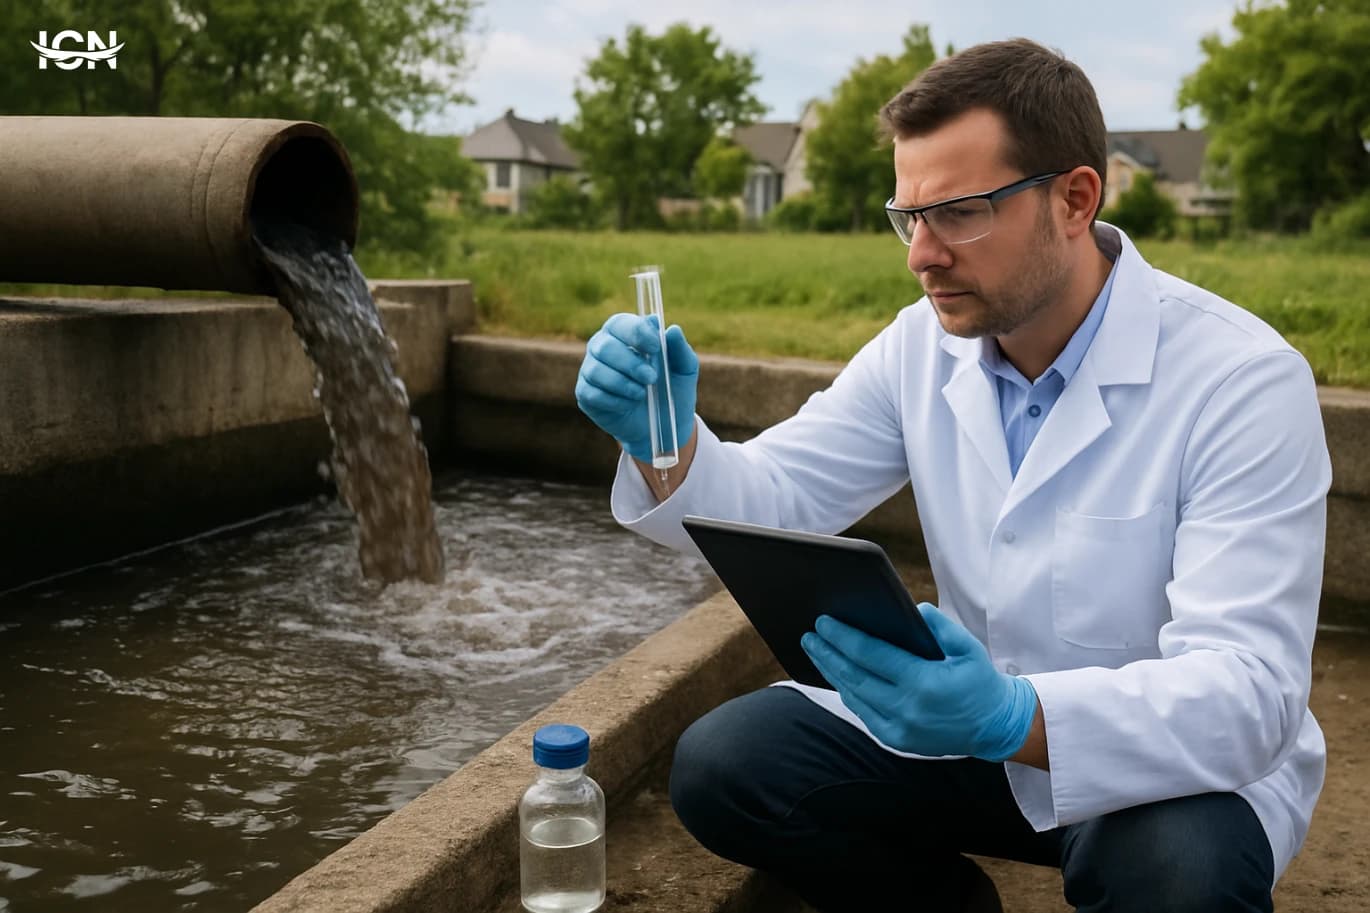
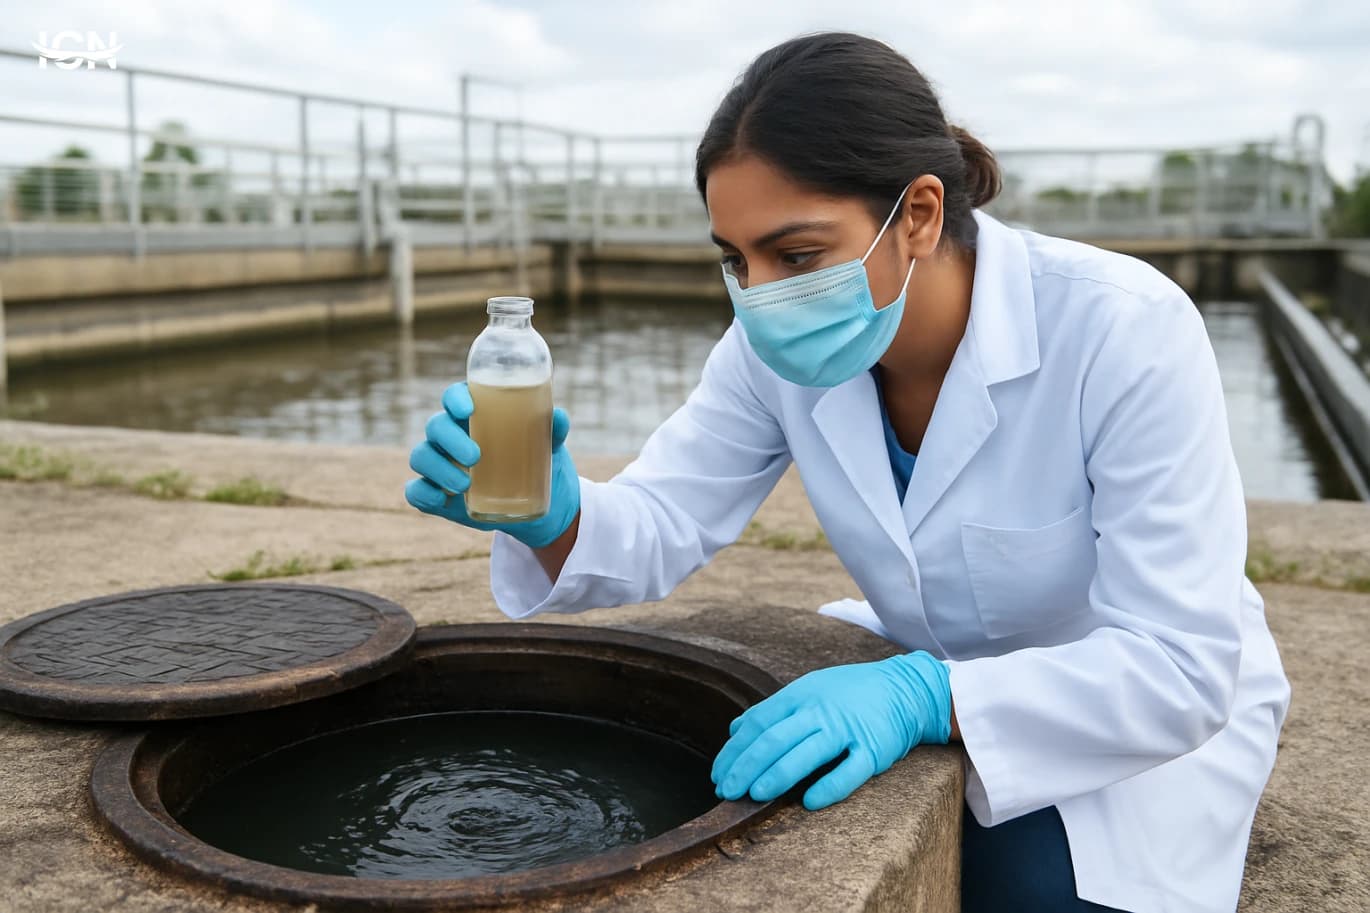
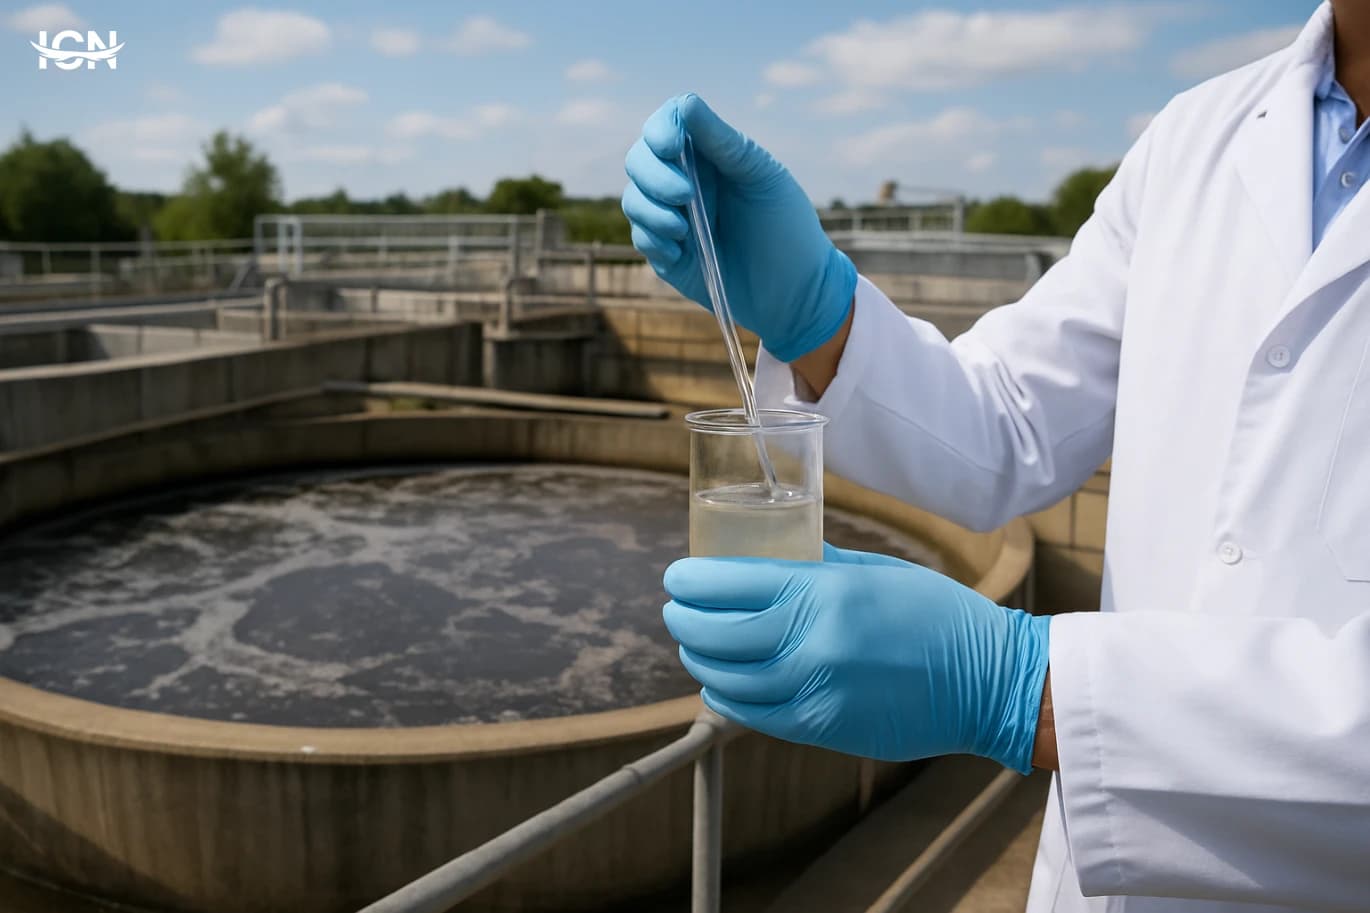
Detecting microplastics is a chain of steps where each choice can change the final count. Researchers start with sampling design: how much water is collected, from which points in the distribution system, and at what time of year. They then filter the sample through membranes with defined pore sizes; a filter that captures particles above 20 micrometers will miss smaller ones, so studies using different filters are not directly comparable. Next comes digestion and cleanup to remove organic material that can hide plastics, followed by visual sorting under a microscope. Visual identification alone can overestimate plastics because natural fibers and mineral fragments can look similar, so many studies confirm polymer type using spectroscopy such as FTIR or Raman. These methods provide a “fingerprint” of the material, but they also have limits: dark or weathered particles can be harder to classify, and very small particles may fall below reliable detection. Laboratories also fight contamination from airborne fibers, plastic labware, and clothing; rigorous protocols use blanks, glass equipment, and clean-air practices to quantify background contamination. A section like this helps readers understand why a single number in a headline is not a universal truth, and why the most credible studies report uncertainty ranges, detection limits, and quality-control results alongside particle counts.
What studies find in tap and bottled water
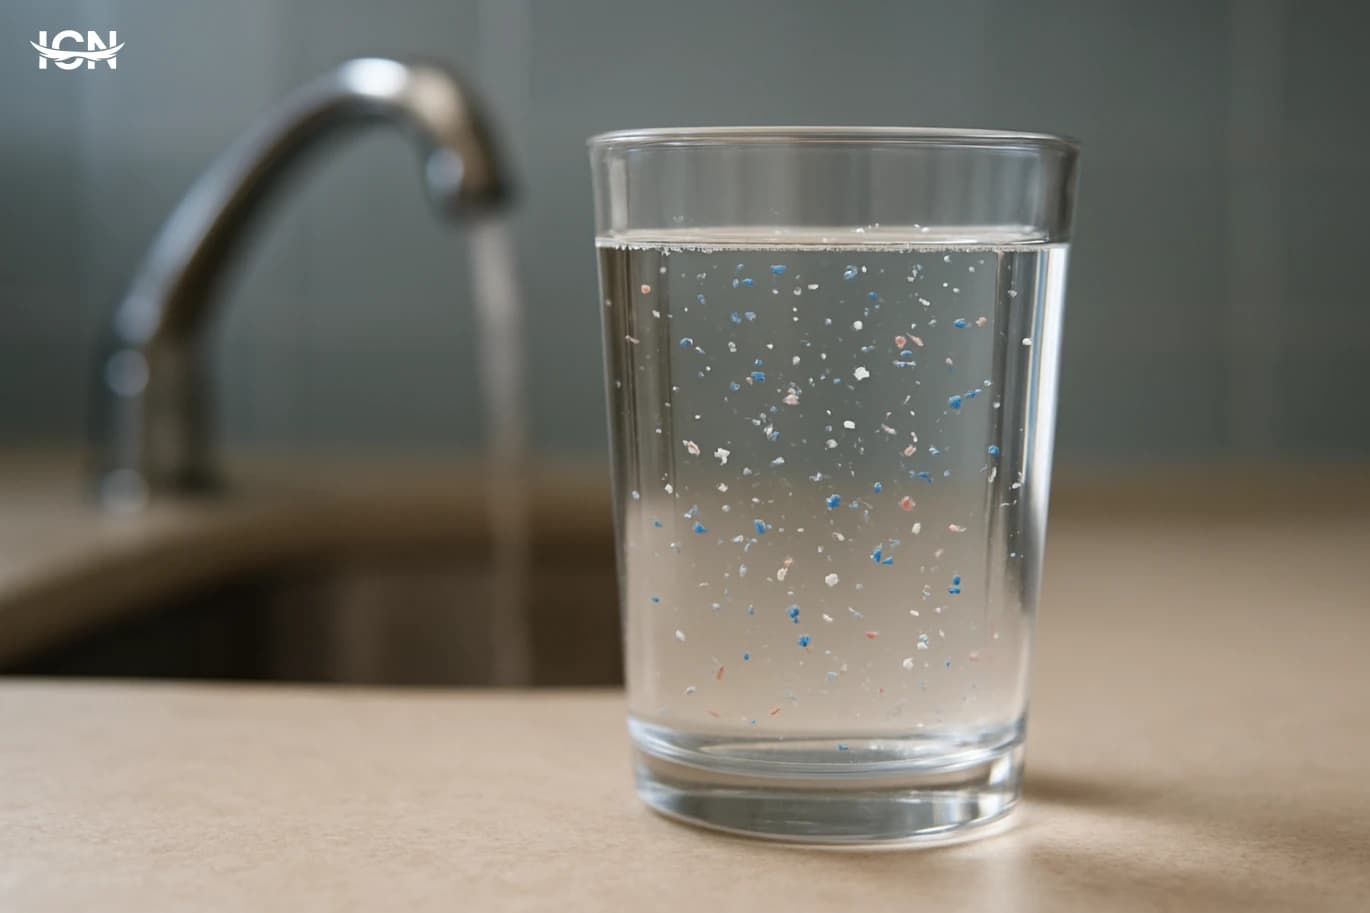
Across published research, microplastics have been reported in both tap and bottled water, but concentrations vary widely. Differences come from geography, water source (surface water versus groundwater), treatment steps, and the analytical methods used. In tap water, particles can originate upstream in rivers and reservoirs, but they can also be introduced within distribution systems through pipe repairs, aging infrastructure, and household plumbing components. In bottled water, the container itself and the bottling process can contribute particles, including fragments and fibers from caps, labels, and filtration cartridges. A careful reading of the literature shows that the smallest particles are often the most numerous, yet they are also the hardest to measure consistently. Many studies therefore focus on a size range they can reliably capture, which means reported totals are often partial counts rather than complete inventories. Another recurring finding is that particle shape matters: fibers are frequently reported, which raises questions about textile sources and airborne deposition during sampling. This section can also address how researchers report results: some use particles per liter, others use mass per volume, and some include polymer type distributions such as PET, polypropylene, or polyethylene. Explaining these reporting choices helps readers compare studies without oversimplifying, and it highlights why standardization efforts in environmental monitoring are a major focus in this field.
Health evidence what is known and what is uncertain
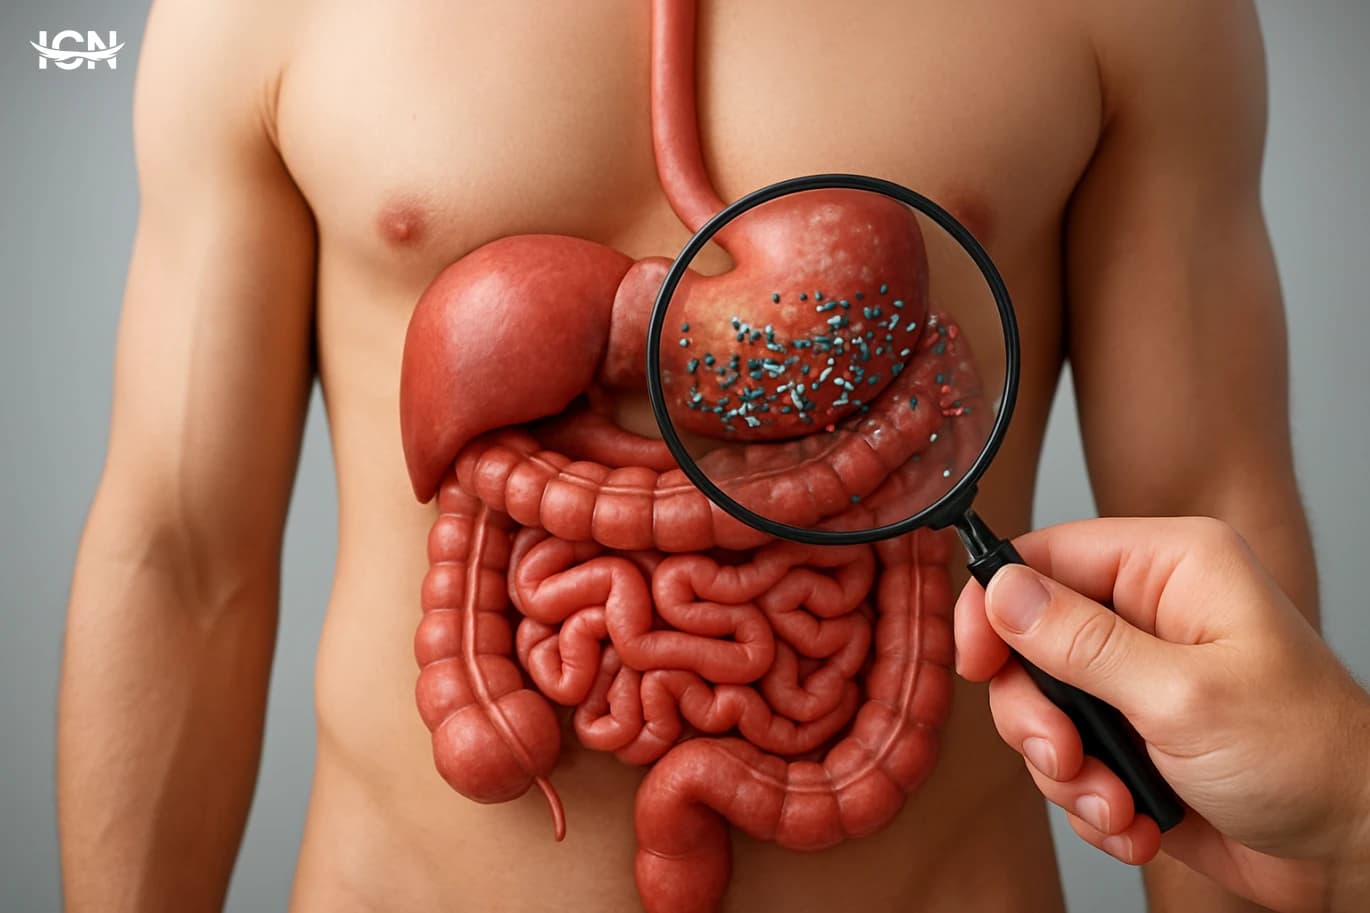
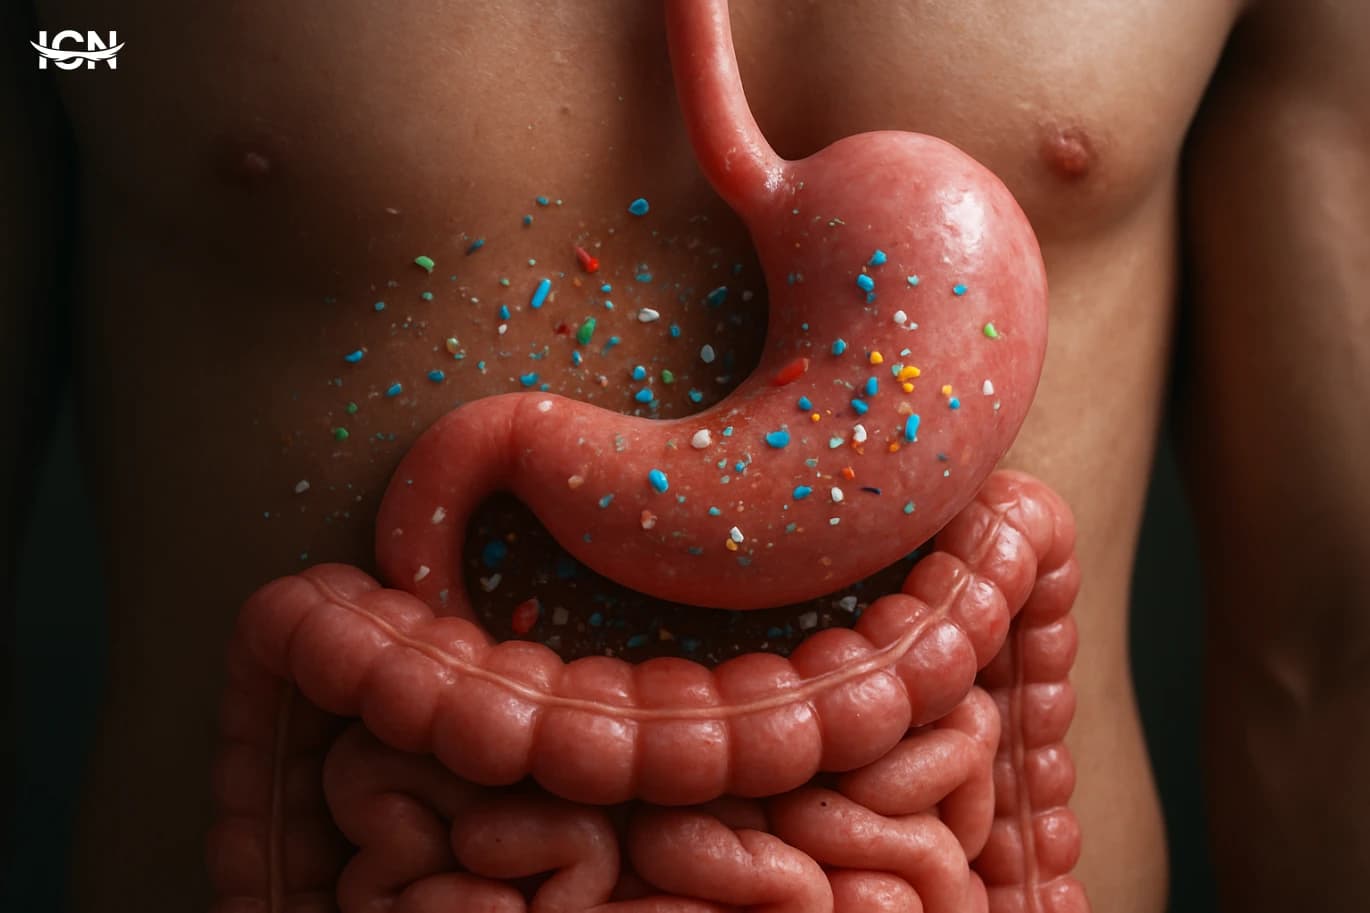
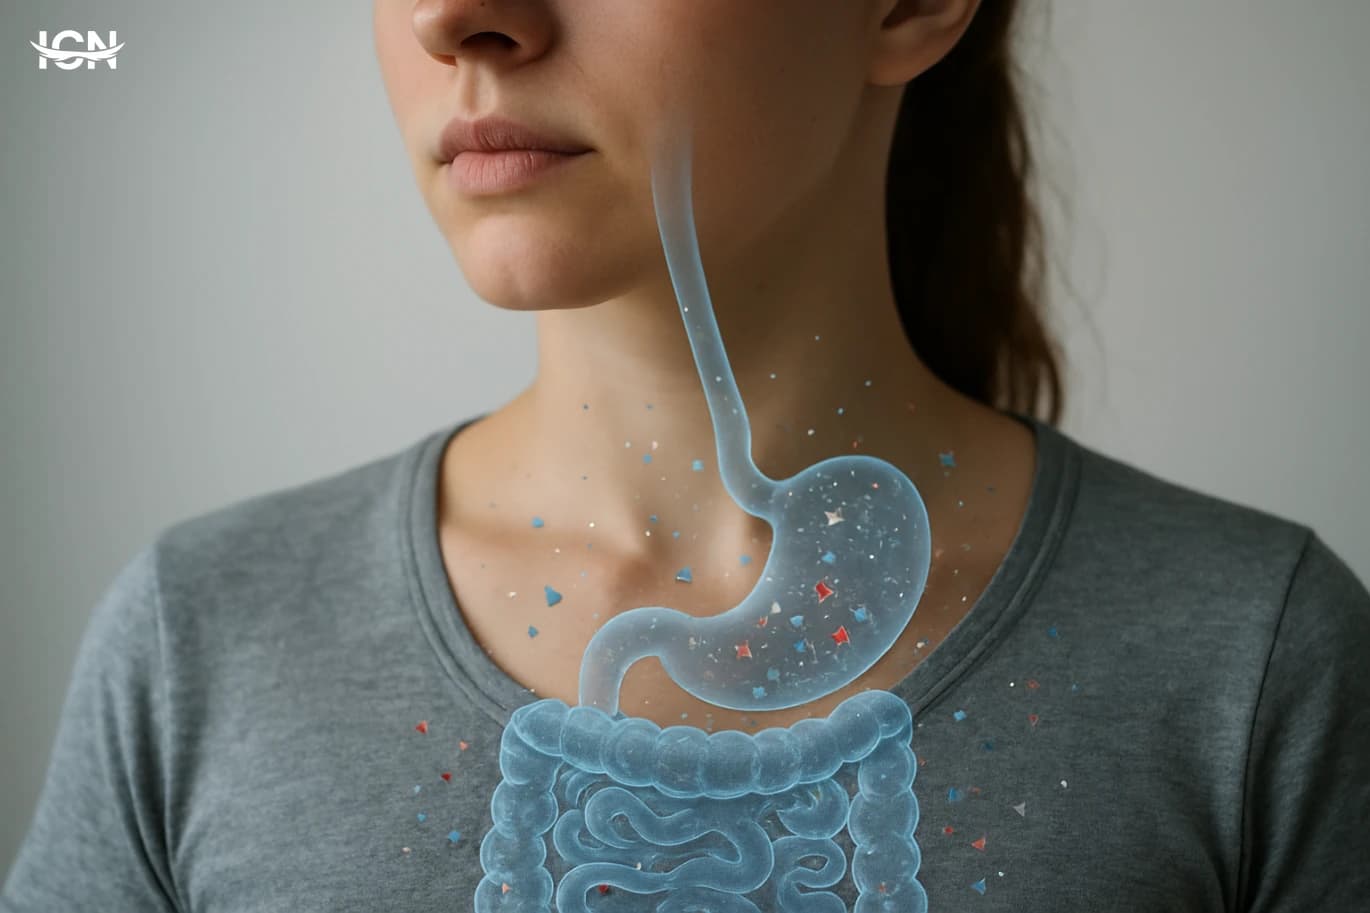
The health discussion is often the most sensitive part of the topic because evidence is still developing. Scientists distinguish between exposure, hazard, and risk. Exposure asks how many particles people ingest from water compared with other sources such as food and indoor dust. Hazard asks what a particle could do biologically, which depends on size, shape, polymer chemistry, and any additives or contaminants on the surface. Risk combines hazard with real-world exposure levels. Current research includes laboratory studies on cells and animals, observational work on environmental samples, and early efforts to understand how particles move through the human body. Larger microplastics are generally expected to pass through the digestive system, while smaller particles may have greater potential to interact with tissues, but measuring the smallest fractions in real drinking-water samples remains difficult. Another area of active research is the “chemical dimension”: plastics can contain additives, and environmental particles can carry other chemicals on their surfaces. However, translating these mechanisms into quantified health outcomes at typical exposure levels is not straightforward. A responsible section should emphasize that the presence of microplastics does not automatically equal proven harm, while also noting why researchers and regulators treat the issue seriously: exposure is widespread, particles are persistent, and better data are needed to set evidence-based guidelines.
What treatment plants and home filters can do
Water treatment can remove a substantial share of particles, but performance depends on the process train and the particle sizes present. Conventional steps such as coagulation, flocculation, sedimentation, and sand filtration can capture many suspended solids, including some microplastics, especially larger fragments and fibers that attach to flocs. Advanced treatments like membrane filtration (microfiltration, ultrafiltration, reverse osmosis) can improve removal for smaller particles, though they require careful operation and create concentrated waste streams that must be managed responsibly. Activated carbon is often discussed; it is effective for many dissolved chemicals, but its role in capturing microplastics depends on system design and particle characteristics. At home, consumers often ask whether pitcher filters, faucet-mounted filters, or under-sink systems help. The evidence suggests that filters with finer pore sizes or membrane elements can reduce particles, but results vary by product and maintenance. A practical section should stress that filter performance declines when cartridges are not replaced on schedule, and that improper installation can bypass filtration. It should also note that reducing microplastics is not the only goal of drinking-water safety; microbial control and chemical compliance remain central. Framing microplastics within the broader context of water-quality management helps readers make balanced choices rather than chasing a single metric.
What to watch next standards monitoring and better data
The next phase of microplastics research in drinking water is likely to be defined by standard methods and comparable datasets. Scientists and public agencies are working toward harmonized protocols for sampling, filtration sizes, polymer confirmation, and reporting units so that results from different cities and countries can be meaningfully compared. Another priority is improving detection of smaller particles, including nanoplastics, without inflating false positives. This requires better reference materials, inter-laboratory comparisons, and transparent quality-control reporting. On the policy and utility side, monitoring programs may expand, but the most useful monitoring will be tied to actionable decisions: identifying sources in a watershed, evaluating treatment upgrades, and tracking changes over time. For readers, the key takeaway is that the science is moving from “are they there?” to “how much, which types, from where, and what reduction strategies work best?” A forward-looking section can also highlight practical research questions: how distribution systems contribute relative to source waters, how seasonal runoff affects particle loads, and how to manage captured particles in treatment residuals. These details keep the topic grounded in measurable progress rather than speculation.