
App Logo

Download Our App

Shop your way

logologo
Image

Practical Observability for Microservices Without Noise

06/06/2026By: ICN Writer
Practical Observability for Microservices Without Noise

Why observability fails in real systems

Many teams adopt logs, metrics, and traces yet still struggle to answer basic questions during incidents: What changed, where is the bottleneck, and which users are affected? The common failure mode is volume without structure. Logs are verbose but inconsistent, metrics are plentiful but not tied to business outcomes, and tracing is enabled but not sampled or correlated correctly. In microservices, the problem multiplies because each service team optimizes locally and ships different conventions. A practical observability approach starts by defining a small set of questions the system must answer quickly. Examples include: “Which endpoint is degrading right now?”, “Is the issue isolated to one region or one dependency?”, and “Did the last deploy increase error rates for a specific customer segment?” If your tooling cannot answer these within minutes, adding more dashboards will not help. The goal is not maximum data; it is reliable, comparable signals that map to user experience and service health.

Start with service boundaries and ownership

Before instrumenting anything, document the service boundaries and the critical paths. For each microservice, list its primary APIs, its key dependencies (databases, caches, message brokers, third-party APIs), and its SLO-relevant user journeys. This inventory becomes the map for what to measure and where to place alerts. Without it, teams often monitor what is easy rather than what matters. Ownership is equally important. Assign an on-call owner for each service and define what “healthy” means in measurable terms. A useful pattern is to maintain a short “service card” that includes: the service’s purpose, top endpoints, expected latency targets, error budget policy, and links to the most important dashboards and runbooks. When a new engineer joins an incident, they should be able to navigate from a failing request to the responsible service and its known failure modes without searching across dozens of tools.

Design metrics that reflect user impact

Metrics should be few, stable, and tied to outcomes. Start with the “golden signals” for each service: latency, traffic, errors, and saturation. Then add one or two business-facing indicators that represent user impact, such as checkout completion rate, search success rate, or message delivery delay. Avoid creating dozens of per-endpoint metrics unless you have a clear use case; cardinality and cost grow quickly in microservices. Define metrics with consistent labels across services. For example, standardize on labels like service_name, route, method, status_code, region, and dependency. This consistency enables cross-service queries such as “show p95 latency for all routes in region X” or “compare error rates before and after deploy Y.” Use histograms for latency rather than averages, and track percentiles (p50, p95, p99) to detect tail latency that users feel. Finally, connect metrics to SLOs: if an SLO is 99.9% successful requests, the error metric must match the same definition of “success” used by the product.

Make logs searchable and consistent

Logs are most valuable when they are structured and queryable. Prefer JSON logs with fixed fields over free-form strings. At minimum, include timestamp, severity, service, environment, request_id, trace_id, route, user segment (if allowed), and a clear error message. This structure enables fast filtering during incidents and reduces time wasted on guessing which service produced a line. Set a logging policy that limits noise. For example, keep INFO logs focused on state transitions and key events, not every internal step. Use DEBUG only behind feature flags or short-lived toggles. For errors, log once at the boundary where the error is handled, and include the upstream dependency and retry status to avoid duplicated stack traces across services. Retention should match operational needs: high-volume debug logs do not need the same retention as security-relevant audit logs. The result is a log stream that supports investigation rather than drowning engineers in repetitive messages.

Tracing that actually helps during incidents

Distributed tracing is often enabled but underused because traces are incomplete or too expensive at scale. The practical approach is to ensure propagation works end to end: trace_id and span_id must flow through HTTP headers, message queues, and background jobs. Instrument the edges first: API gateways, ingress controllers, and the services that call external dependencies. These are the places where latency and failures enter the system. Sampling should be intentional. Use head-based sampling for baseline visibility and tail-based sampling to keep traces that include errors, high latency, or specific routes. Define a small set of “always keep” rules, such as retaining traces for 5xx responses, timeouts, and requests above a p99 threshold. Add semantic attributes that make traces searchable: route templates, dependency names, cache hit/miss, and retry count. When done well, tracing lets you answer “where did the time go?” across services in one view, without manually correlating timestamps from multiple logs.

Alerting and dashboards that reduce fatigue

Alert fatigue is usually a design problem, not a staffing problem. Alerts should be driven by SLO burn rate and user impact, not by every metric threshold. A solid baseline is to alert on error rate and latency relative to an SLO, plus a small number of dependency health checks that historically cause outages. Keep alerts actionable: each alert should include the affected service, the suspected scope (region, route, dependency), and a link to a runbook. Dashboards should tell a story in a consistent layout. For each service, maintain a primary dashboard with: traffic, error rate, latency percentiles, saturation (CPU, memory, queue depth), and top dependencies. Add a deploy overlay so engineers can correlate changes with performance shifts. Avoid “wall of graphs” dashboards; instead, create a small set of focused views: one for on-call triage, one for capacity planning, and one for product impact. Review alerts monthly, remove noisy ones, and track mean time to detect and mean time to resolve to see whether observability is improving.


* All articles published on this blog are sourced from various websites and are provided for informational purposes only. They should not be considered as confirmed studies or accurate information. Please verify the information independently before relying on it.

Similar ARTICLES

Free Account Verification Without the Confusion
“Free account verification” usually means the platform does not charge a direct fee to grant a verified badge or to complete an identity or business check. That does not mean the process is effortless, instant, or identical across services. Some platforms offer verification as a standard feature for eligible accounts, while others reserve it for accounts that meet specific criteria such as authenticity, completeness, and public interest. In many cases, the “cost” is time: preparing documents, improving account signals, and waiting for review. It is also important to separate three different ideas that people often mix together. First is identity verification, where a platform confirms a real person or a registered organization. Second is account verification for credibility, where the platform signals that an account is authentic and notable. Third is security verification, such as enabling multi-factor authentication or confirming a phone number and email. A platform may offer one for free and restrict another. Understanding which type you need helps you avoid chasing the wrong badge or submitting the wrong information.
When Gaming Becomes a Money Drain
The modern video game market is no longer centered on a one-time purchase. Many of today’s biggest titles operate as ongoing services: they launch, then keep selling content, upgrades, and time-saving options for months or years. This shift has expanded the industry’s revenue, but it has also changed the player’s relationship with entertainment. Instead of paying once and finishing a game, players are repeatedly asked to spend to keep up with seasonal updates, limited-time items, and competitive progression. This model is visible across mobile, console, and PC. Mobile games often rely on frequent microtransactions and ad-based incentives. On consoles and PC, the “live service” approach uses season passes, cosmetic stores, and periodic expansions. The result is a market where the baseline cost is only the entry point, and the total cost depends on how much a player wants to participate in the game’s evolving ecosystem. For households, this can turn a hobby into a recurring expense that is harder to track than a single purchase. The spending pressure is not always obvious. Many games present purchases as optional, but they are integrated into the user experience: store tabs are placed next to gameplay menus, pop-ups appear after matches, and limited-time offers are framed as opportunities that will disappear. The market’s growth is tied to these design choices, which blur the line between playing and shopping.
Too Many Subscriptions, Too Much Exposure
Digital subscriptions are not just monthly fees; they are ongoing data relationships. Each service you keep active typically stores a profile that includes your name, email, device identifiers, payment tokens, usage history, and sometimes location signals. Over time, this creates a broad footprint spread across dozens of vendors, support tools, analytics platforms, and payment processors. Even when a service is reputable, the number of places your data exists multiplies as the service integrates with marketing automation, customer support chat, and third-party identity providers. The risk grows with volume. A single account may be well protected, but ten or twenty accounts increase the chance that one uses weaker security settings, outdated software, or overly permissive data sharing. Subscriptions also encourage “set and forget” behavior: you sign up during a free trial, connect an account for convenience, and never revisit the privacy settings. That is how small decisions accumulate into a large exposure surface, especially when you reuse the same email, password patterns, or payment method across services.
Practical Observability for Microservices
Microservices increase delivery speed, but they also multiply failure points. A single user request may traverse an API gateway, several services, a message broker, and multiple databases. When latency spikes or errors appear, traditional monitoring that only checks CPU and uptime rarely explains what actually happened. Observability focuses on understanding system behavior from the outside by collecting signals that let engineers answer new questions without redeploying code. In practice, observability is not a product you buy; it is a set of engineering choices. It requires consistent instrumentation, shared conventions across teams, and a clear plan for how data will be used during incidents and performance work. The goal is to reduce time-to-diagnosis and to make changes safer by giving teams fast, reliable feedback about real production behavior.
Designing Reliable Webhooks at Scale
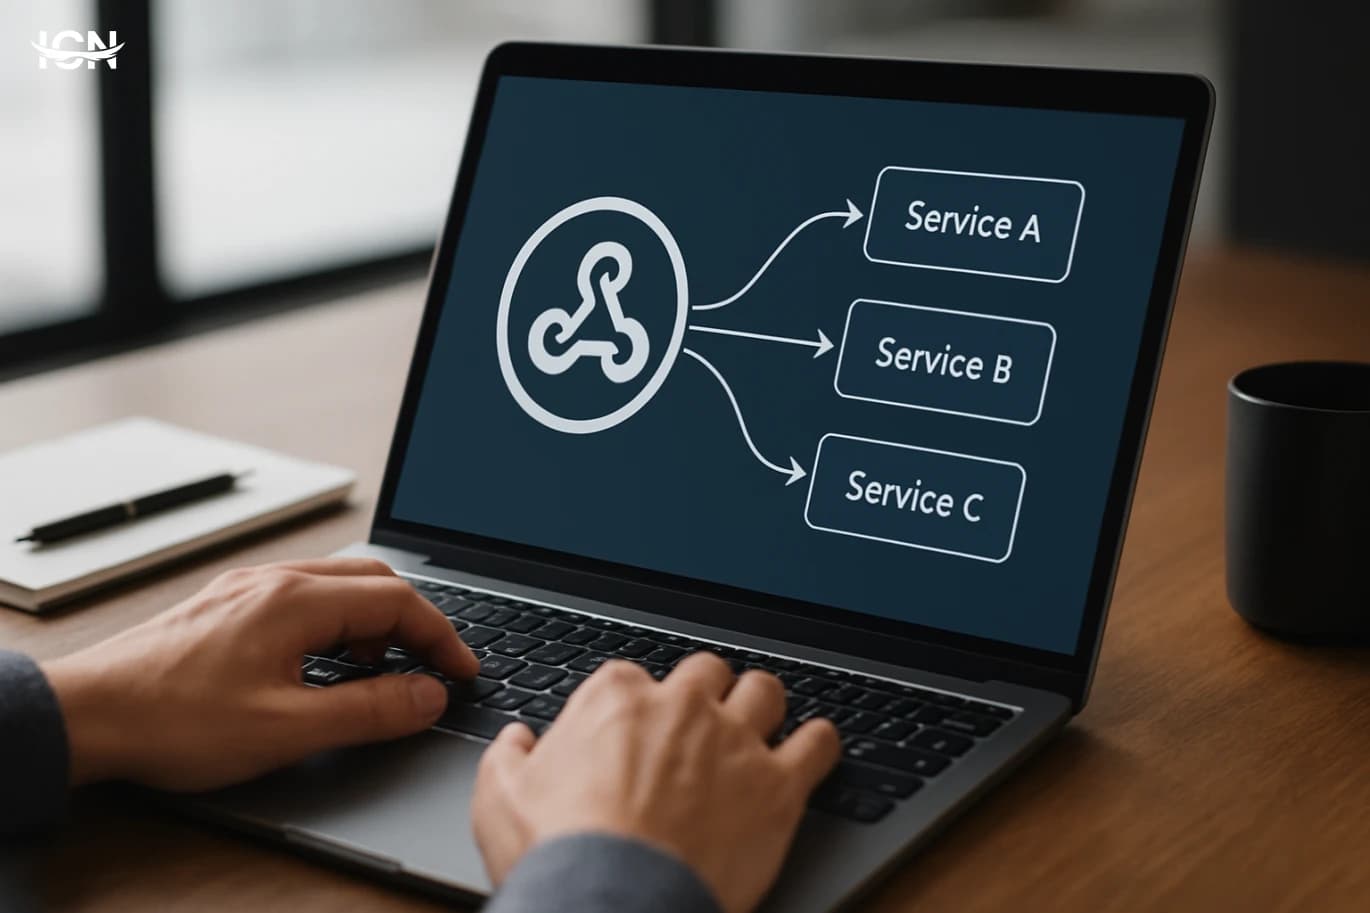
Webhooks look simple: an event happens, an HTTP request is sent, and a downstream system reacts. In production, that simplicity breaks down because delivery depends on networks, DNS, TLS, load balancers, and application code on both sides. Common failure modes include transient 5xx responses during deploys, timeouts caused by slow receivers, and retries that amplify load during incidents. Another frequent issue is ambiguity: a receiver returns 200 but fails internally, or a sender marks a delivery as failed even though the receiver processed it after a timeout. At scale, these edge cases become routine and can silently create data drift between systems. Reliability starts with treating webhook delivery as a distributed systems problem. You need clear delivery semantics, durable storage of events, and observability that can answer basic questions quickly: which events were generated, which were attempted, which were acknowledged, and which are stuck. Without that, teams end up debugging by searching logs across services and guessing whether a customer’s system is at fault or the sender’s infrastructure is. A reliable design makes failures expected, measurable, and recoverable rather than surprising.
Strong Passwords Without the Headache
Even with fingerprint and face unlock, passwords remain the core key behind most accounts. They are used to sign in on new devices, approve sensitive changes, and recover access when something goes wrong. Many services also rely on passwords as the first step before sending a verification code, which means a weak password can turn a “two-step” process into a single point of failure. The risk is not only someone guessing your password manually. The more common problem is reuse: one leaked password from an old site can be tried automatically on email, banking, shopping, and social accounts. Attackers also use lists of common patterns, such as names plus birth years, keyboard sequences, or predictable substitutions like “P@ssw0rd”. A strong password strategy is therefore less about memorizing a clever phrase and more about reducing predictability and limiting the damage if one account is compromised. A practical approach starts with prioritizing. Your email account, cloud storage, and password manager are “master keys” because they can reset other accounts. These deserve the strongest protection and the most careful recovery settings. Less critical accounts still need unique passwords, but you can manage them efficiently with a consistent method and the right tools.
Practical Guide to API Rate Limiting
Rate limiting is a core reliability control for any public or internal API. Without it, a single misconfigured client, a sudden traffic spike, or an expensive endpoint can exhaust CPU, database connections, or third‑party quotas. The result is not only slower responses but cascading failures across dependent services. Rate limiting also supports fair usage: it prevents one tenant or integration from dominating shared capacity and helps you offer predictable performance to everyone. Beyond stability, rate limiting is an operational tool. It gives teams a lever to shape traffic during deployments, incidents, or migrations. It also reduces cost by limiting calls to endpoints that trigger heavy compute, large payloads, or paid upstream requests. When designed well, it becomes part of your product contract: clients know what to expect, and your platform can enforce those expectations consistently.
Practical Observability for Microservices Without Noise
Many microservice programs invest early in dashboards and alerting, yet still struggle to answer basic questions during incidents: What changed, where is the latency coming from, and which customers are affected? The failure is rarely a lack of tools. It is usually a lack of focus on a small set of signals, inconsistent instrumentation across services, and an alerting strategy that rewards volume over accuracy. Teams often collect hundreds of metrics per service, but cannot connect them to user experience or business impact. Another common issue is treating logs, metrics, and traces as separate projects owned by different people. When each signal is designed in isolation, correlation becomes difficult and expensive. Engineers then fall back to manual guessing and ad hoc queries, which slows response and increases risk. A practical observability approach starts by defining what “good” looks like for users, then building a minimal, consistent telemetry model that makes root cause analysis repeatable across services and environments.
Practical Guide to API Rate Limiting
API rate limiting is a control layer that caps how many requests a client can make in a time window. It protects services from traffic spikes, abusive automation, and accidental loops that can exhaust CPU, database connections, or third‑party quotas. It also improves fairness by preventing a small number of clients from dominating shared capacity. In production, rate limiting is often tied to business rules: free tiers might allow 60 requests per minute, while paid tiers get higher limits and better burst tolerance. Rate limiting is not the same as throttling, although they are related. Rate limiting decides whether a request is allowed; throttling shapes traffic by delaying or smoothing requests. Many systems combine both: reject when a hard limit is exceeded, but also apply soft limits that slow clients down before they hit the wall. Clear limits reduce operational incidents and make capacity planning more predictable because you can translate limits into worst‑case load on downstream services.
API Application Programming Interage: Defining - its uses - its uses
What is the API programming interface (API) is a set of rules and directions that allow applications to interact with each other. API is one of the basic elements in the development of modern software, as it enables developers to create applications that communicate with other services or systems in an effective and smooth way. The importance of the uses of the application programming interface. Application interfaces are a vital tool to enhance innovation and improve the user experience. By allowing multiple applications to interact, developers can integrate new features and provide rich services. API also contributes to speeding up the development process and reducing costs, which enhances the competitiveness of business in the market.
Merging artificial intelligence technologies to customize the shopping experience in applications
Definition of artificial intelligence techniques The techniques of artificial intelligence include a group of systems designed to simulate human intelligence, including machine learning and natural language processing. These technologies excel in analyzing data and concluding patterns from them, which makes them strong tools in various fields. The importance of customizing the shopping experience in applications to customize the shopping experience in applications enhances the user's relationship with the brand. Instead of providing uniform content, these technologies allow user preferences, which contributes to providing offers and products that are appropriate to their needs. Thus, users feel that they get a unique experience, which increases the chances of conversion and retaining customers.
By clicking the SUBSCRIBE button, you are agreeing to our Privacy & Cookie Policy If you want to unsubsribe the marketing email, please proceed to our privacy center.
© 2005-2026 ICN. All Rights Reserved.